
Workload Automation
Tidal Explorer
An optimization tool with powerful analytics and visualizations for identifying and improving conditions that affect optimal processing of workloads

Simplify schedule design and runtime complexity
Identify execution bottlenecks that affect optimal processing
Reduce time to resolve production issues
Visualization for Complex Schedules
Get a detailed graphical view of your schedules to better understand the workflow design and how it’s performing. Analyze job designs, calendar designs and runtime behavior of the schedules to identify improvements.
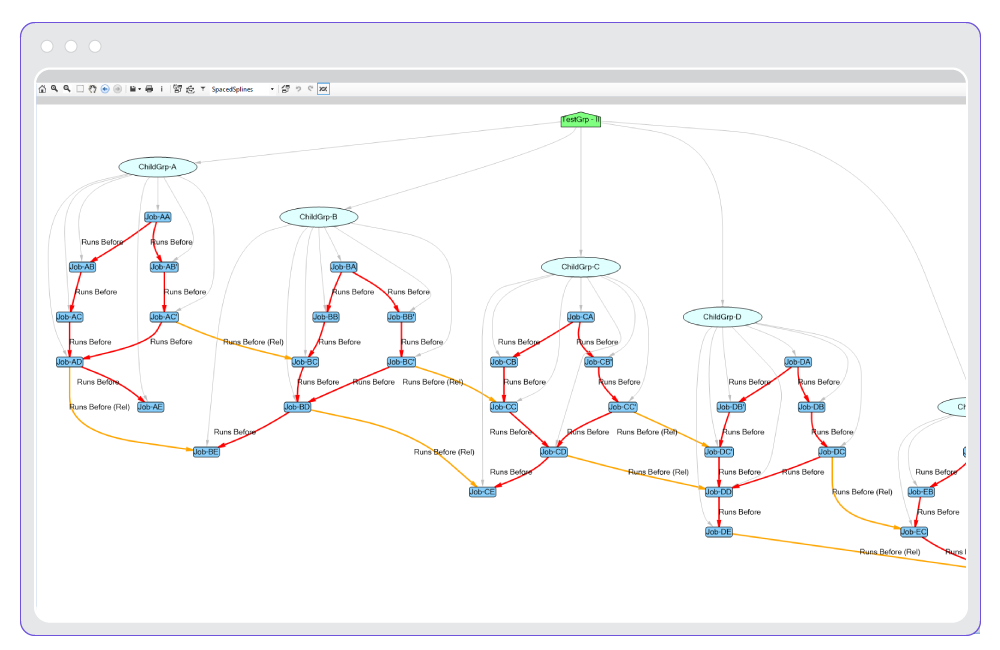
View job design structure including group-to-child and dependency relationships.
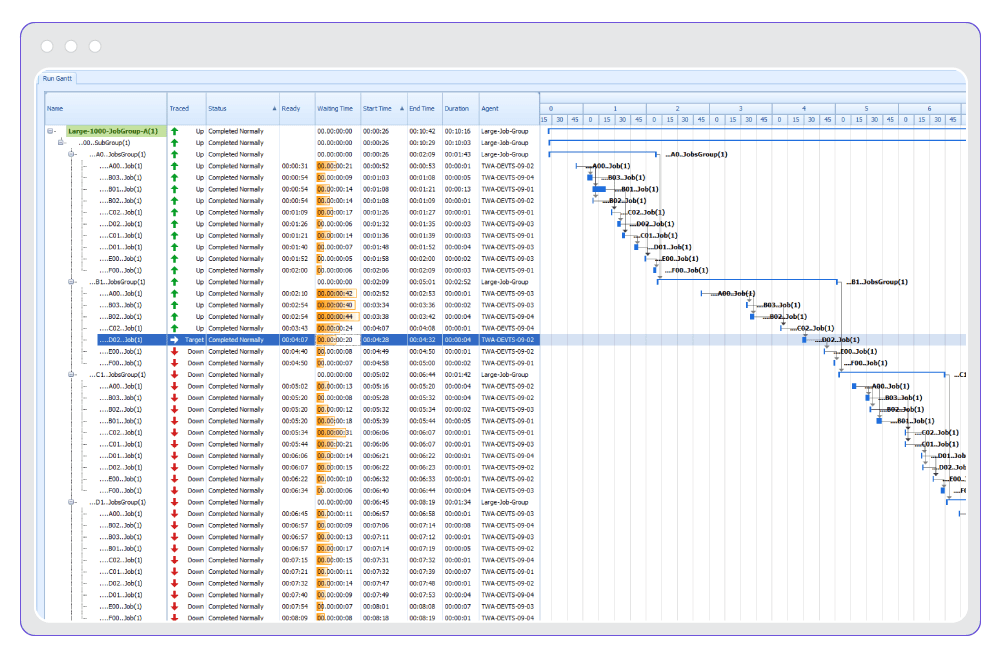
Gantt view of a target job with upstream and downstream tracing and time stream filtering enabled.
Gantt View & Trace Analysis
Upstream and downstream dependency tracing enables what-if analysis so you can identify issues that could affect optimal processing. For example, answer questions like:
- What downstream jobs will be impacted if job X slows?
- What upstream jobs need to run before job Y runs?
SLA Analysis
Review and analyze SLA performance for your scheduling activities. SLA results are presented as summaries with the ability to drill down to chart views and more detailed job run information in Gantt views. view job start/stop times in relationship to their SLA thresholds for comprehensive SLA analysis.
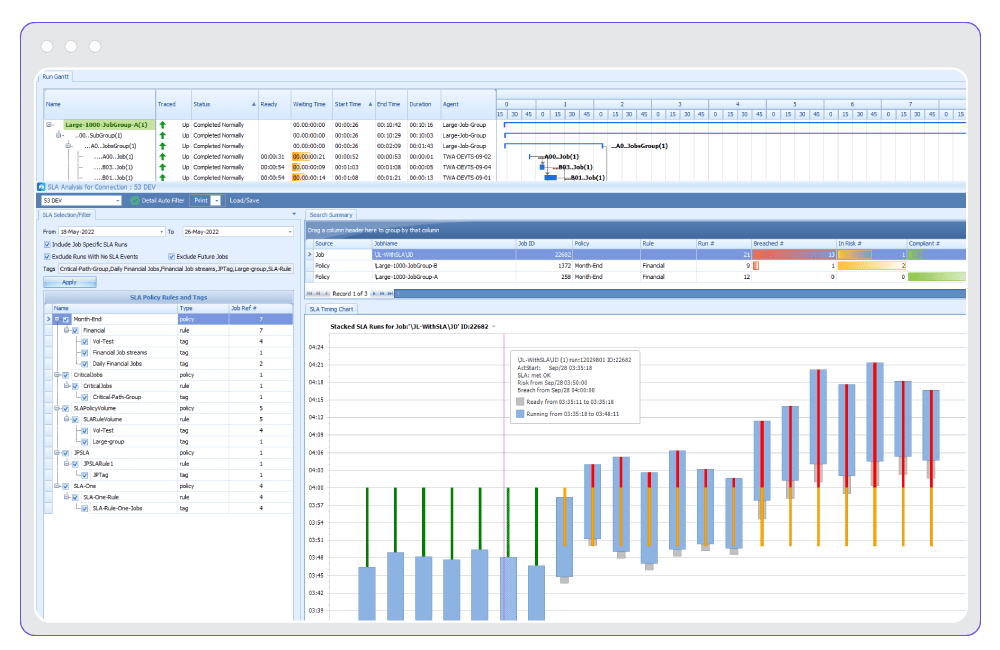
Search SLA results by SLA policy, display the most-breached rules and drill down for more detail.
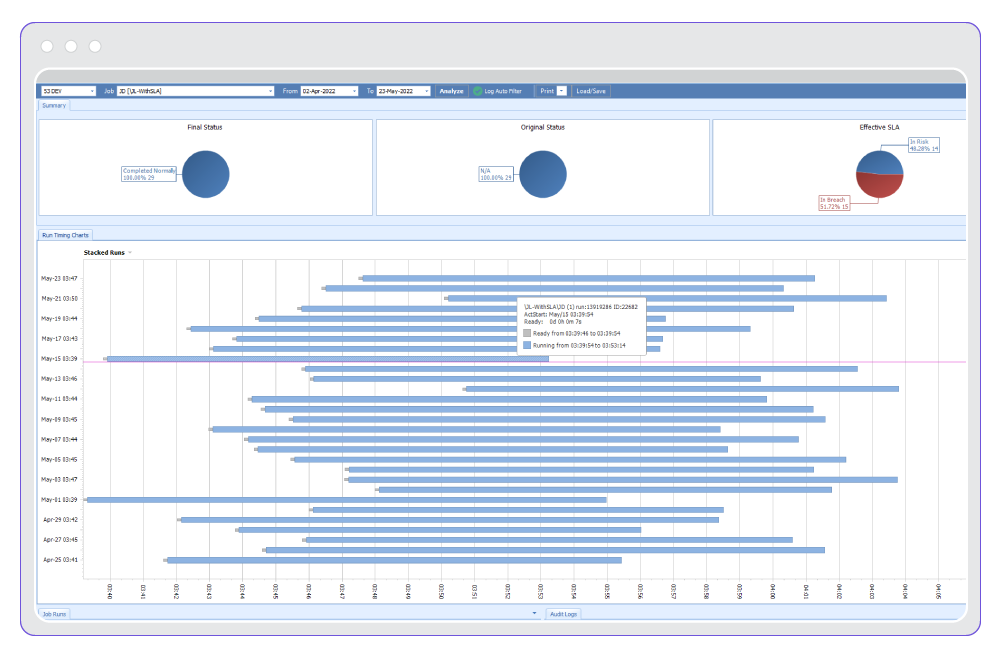
Job run analysis with summary statistics and run timing charts.
Job Run Analysis
Review and analyze a job’s historic run performance and run state statistics. Results are presented in summary charts and grid views. Use the run timing chart to identify trends affecting drifts in job start/stop times as well as job wait and duration times. Drill down to Gantt views for detailed run performance analysis.
Comparison Tools
Quickly detect variations with side-by-side comparisons of schedules, jobs, calendars and other elements.
- Run a comparison within an instance (e.g., Production) – see a snapshot of the database from last week vs. today to understand what has changed
- Run comparisons across instances (e.g. Dev vs. Production) – ensure schedule changes are ready for promotion
- Identify duplicate and unused calendars for consolidation or deletion
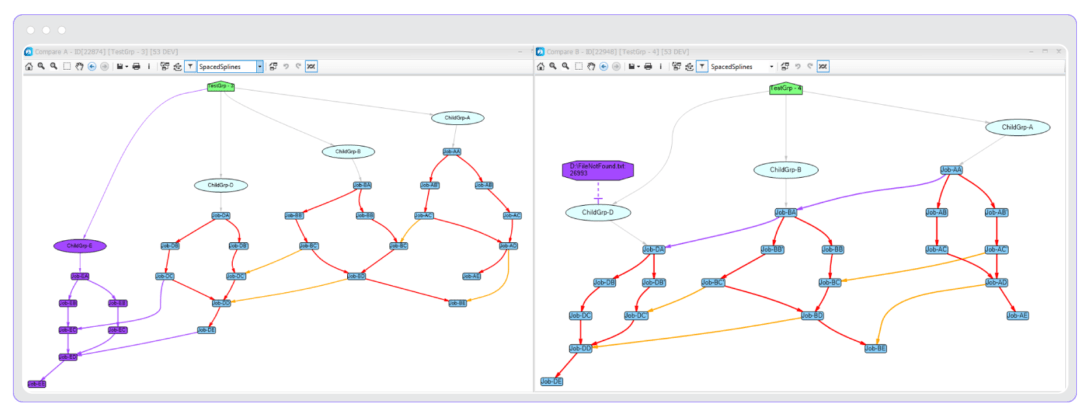
Colors highlight structural differences between job trees (e.g., added/deleted jobs and dependencies).
Master Health Dashboard
The Tidal Master is the central scheduling engine/server. Use this dashboard to monitor performance and health of the Master and identify opportunities for tuning. Queue statistics can reveal blocking queues where the number of jobs in the waiting state exceeds the queue’s job limit for a period of time.
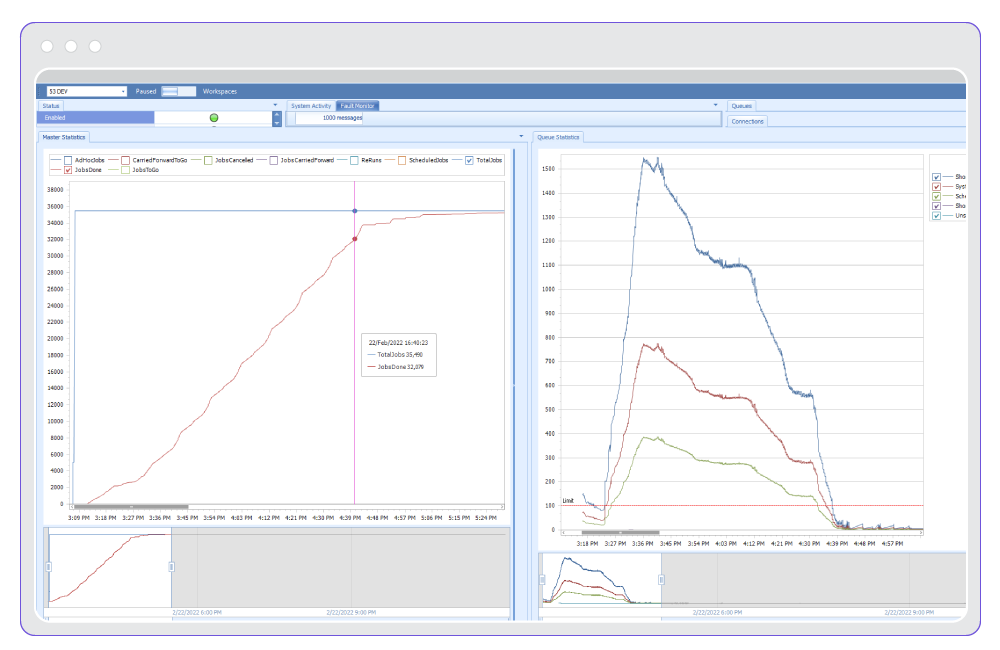
Master dashboard queue statistics can identify blocking queues.
Reporting & Analytics
A full suite of standard reports offers unique insights so you can improve design, operations and overall performance.
- Historical Analysis Reports provide trend analysis for key job run performance areas such as duration, counts, dependencies, etc. You can easily identify jobs that are slowing down or resulting in the most errors, for example.
- Design Reports reveal important aspects about complexity of your schedules based on a variety of metrics and criteria such as job size, jobs by agent/agent list and dependency chains.
- Housekeeping Reports identify duplicate or unused calendars, incomplete event associations or disabled jobs that may be candidates for removal from the schedule to improve performance.
Resources